Cloverfields was platted in 1959, and the first newspaper ads for its home sites ran in 1957. By 1977, 907 of its 972 lots were still empty. The neighborhood was almost entirely built out by the 1990s. So most of the houses in a subdivision platted in the Eisenhower years went up in the two decades after 1977. The subdivision's name tells a buyer when the streets were drawn. It doesn't tell them when the house was built.
The same is true across most of Kent Island's older bayside neighborhoods, and it matters more than usual this winter. Buyers comparing Stevensville against Annapolis-side options usually start with a subdivision name and a county median. On this island, both are weak guides to what a given house is worth.
Lots Were Sold First, and the Houses Came Later
Much of Kent Island's housing goes back to one developer working before the first Bay Bridge span opened. A June 2024 historic context study prepared for the Maryland Transportation Authority's Bay Crossing Study records that David Nichols had subdivided former farms into 2,800 lots by the time the bridge opened in 1952. By 1960 he had 4,681 lots across six subdivisions: Kent Island Estates, Harbor View, Bay City, Romancoke on the Bay, Chesapeake Estates and Cloverfields.
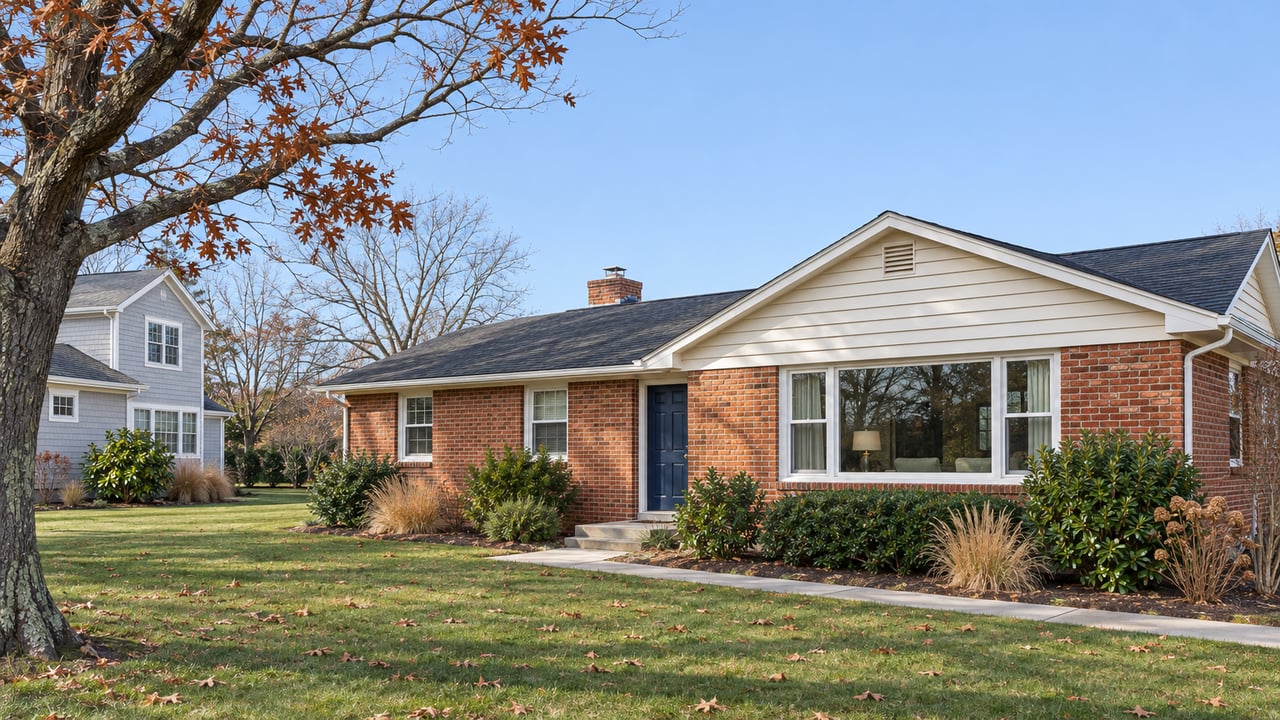
Nichols mostly sold lots and built only a few speculative houses. Owners built to their own designs, though most chose the popular small styles of the day, minimal traditional houses and ranches. Every one of the six subdivisions had frontage on the Chesapeake Bay or a tributary, and their amenities included public beaches, piers and picnic areas.
Kent Island's lot-sale subdivisions filled in one owner at a time, so a single street can hold houses from several decades.
One Plat, Four Decades of Houses
The study traces how three of these neighborhoods actually filled in, and none of them took less than a generation.
Harbor View, the circa-1952 Nichols subdivision in Chester west of Cox Neck Road, has 377 residences and three churches on 217 acres. Its lots are narrow and deep, from a quarter acre to half an acre. Because owners built the houses rather than choosing from developer models, construction ran from the late 1940s through the 1960s and picked up substantially in the 1970s. Small 1950s ranches sit beside larger ramblers and Colonial Revival houses from the 1960s and 1970s, and the oldest houses are concentrated along the water on Harbor Drive.
Bay City was first platted in 1952 and laid out to maximize waterfront lots, with roughly 812 lots in all. Aerial photos from 1957 show only part of the street grid and a few houses, most of them along the water. The grid was complete by 1970, and by 1982 most lots had houses on them.
Cloverfields, Nichols' last Kent Island subdivision, covers 337 acres. Its streets curve more than in his other neighborhoods, and its build-out ran latest of the three.
In Harbor View and Bay City, the lots nearest the water were often built first, so they tend to hold some of the oldest houses. A buyer looking at a bayside lot may also be looking at the most dated house on the street, while an inland house a few blocks back may be decades newer. Neither fact sets the price alone, but it explains why two listings with the same subdivision name in the remarks can be far apart on price, and why an average for the subdivision tells you little about either one.
Other plats followed the same pattern on different schedules. Kent Island Estates, Nichols' oldest and most ambitious development, was platted in sections in 1949 and 1950 along Romancoke Road. Tower Gardens on the Bay, off Kent Point Road, was platted beginning in 1952. Its later sections southeast of Tower Drive came from a different developer starting in 1973, with a new round of lot advertising.
What the Subdivision Name Does Tell You
The house dates itself. What the subdivision name reliably tells a buyer is which shared waterfront comes with the house and who runs it. Each of these neighborhoods came with its own beach, pier, ramp or stranger amenity, and those amenities have outlasted the original developers.
Cloverfields is the clearest case. Its improvement association incorporated in September 1961 to keep the recreation area in owners' hands. The association was formed to own and operate those facilities, a role it continues today. The Cloverfields Property Owners Association lists a community beach with a pavilion, grills, a fishing pier and a playground, plus a boat basin with a ramp and marina. It also lists a pool and a clubhouse of about 1,800 square feet at 101 Nichols Manor Drive. The clubhouse stands where the historic Cloverfields house stood until it was demolished around 2015. According to the association's dues page, annual dues starting in 2026 are $235 for a single property, with a $20 lot fee for each additional property.
The other neighborhoods each come with something different:
- Bay City: The original northwest beach reservation was eventually sold for private development. The southwestern reservation remains a private community park and beach on the southwest side of Bayside Drive.
- Chesapeake Estates: A community beach and clubhouse at the southwest corner of Bay Drive, managed by the Chesapeake Estates Improvement Association.
- Kent Island Estates: Its community association building is at 9402 Romancoke Road.
- Kentmorr: Developed by Nathan "Bill" Morris and platted in 1947, it has a 2,400-foot grass runway, a marina and eleven houses with attached airplane hangars. Property owners formed an association in 1983 to buy and manage the airfield.
Kentmorr Marina at 910 Kentmorr Road is also home to Channel Side, whose menus include lunch, dinner, pizza and Holly's Cafe.
For houses outside these associations, or for anyone comparing what the public shoreline already provides, Queen Anne's County runs two piers nearby. Matapeake has a 650-foot lighted fishing pier, a 25-foot-wide boat ramp and a three-acre picnic area. Romancoke Pier, at the end of Romancoke Road on the old ferry wharf, has a 600-foot fishing pier, a picnic area and a kayak ramp. The county lists parking at both at $2.50 an hour.
Why the County Median Is a Poor Guide This Winter
The newest market figures cover all of Queen Anne's County rather than Stevensville alone, and they move more than most buyers expect. Bright MLS's October 2026 Maryland Eastern Shore report, with data as of November 6, shows 89 closed sales in the county in October 2026, up 3.5% from October 2025, at a median sold price of $555,000, up 1.8%. One month earlier, Maryland Realtors' September 2026 statistics showed only 58 sales in the county that month at a $497,500 median, down 8.0% from September 2025.
The median rose about $57,500 in one month, and house values didn't change that fast. With 58 to 89 sales a month across a whole county, the median moves with whatever happened to close. A month weighted toward newer houses can produce a very different number from a month weighted toward 1950s ranches. That's the same mix of house ages the subdivision histories describe, and it adds up to a county statistic that shifts from month to month.
What the October data does show clearly is how much time buyers have. Queen Anne's County had 302 active listings in October 2026, up 27.4% from a year earlier, and 4.31 months of supply, up 0.9 months. Median days on market reached 40 in October 2026, 15 days more than in October 2025. Buyers also signed fewer contracts and made fewer showing visits. New contracts were 74 in October 2026, down 9.8%, and showings were 623, down 23.8% from October 2025.
Bright's commentary for the wider Eastern Shore says buyers changed their plans after mortgage rates moved. It expects the market to stay slow for the final months of 2026, with softer prices and more time to decide for the buyers who remain.
On Kent Island, that extra time is best spent judging each house on its own record. A buyer this winter can tour two houses in the same subdivision, check each one's build year in the listing, and walk from both to the community beach before deciding which one fits.
A Comparison Sheet for a Stevensville Showing
The plat year and the subdivision name are the two fields to put aside. What belongs on the sheet is the year the house was built and how much it has been updated since. Next comes the association: which one it is, what it owns, its current dues, and how far the house is from the beach, ramp or pier. In Cloverfields, that's a 2026 dues figure the association publishes on its own site. Last is the price per square foot of recent sales of houses from a similar decade, not a subdivision average that mixes houses from the 1950s with houses from the 1990s.
That comparison is harder than reading a median off a portal, and it is how prices on this island actually get set. If commute time is also on your sheet, our post on what the Bay Bridge toll leaves out covers that cost. The dues and fees above are dated figures for general information, not legal, tax or financial advice, so confirm your own situation with the right professional.
If you're weighing a house in Bay City, Cloverfields, Kentmorr or Kent Island Estates this winter, Romeo Santos III and the team can help you build that comparison sheet before you write an offer. If you already own one of these homes, get your free home valuation and see how your house compares with others of its era.